How to build an experience map
Official experience map template on Miro (English)
What is an experience map?
An experience map is a visual chart of the different steps a group of people goes through during an experience, along with the emotions they feel. Its goal is to represent a lived experience in a very concise, visual way.
The strength of an experience map lies in its visual, synthetic format that puts emotions front and center. It’s a particularly effective tool in workshops to help your audience see where the pain points and moments of satisfaction are in a user journey.
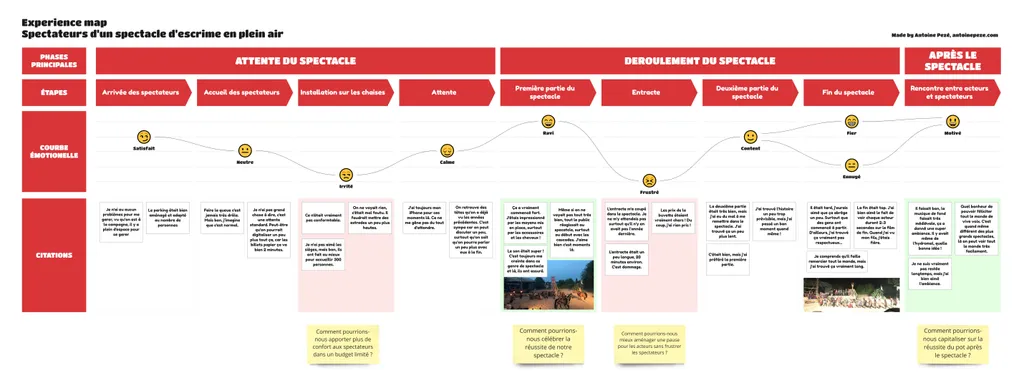
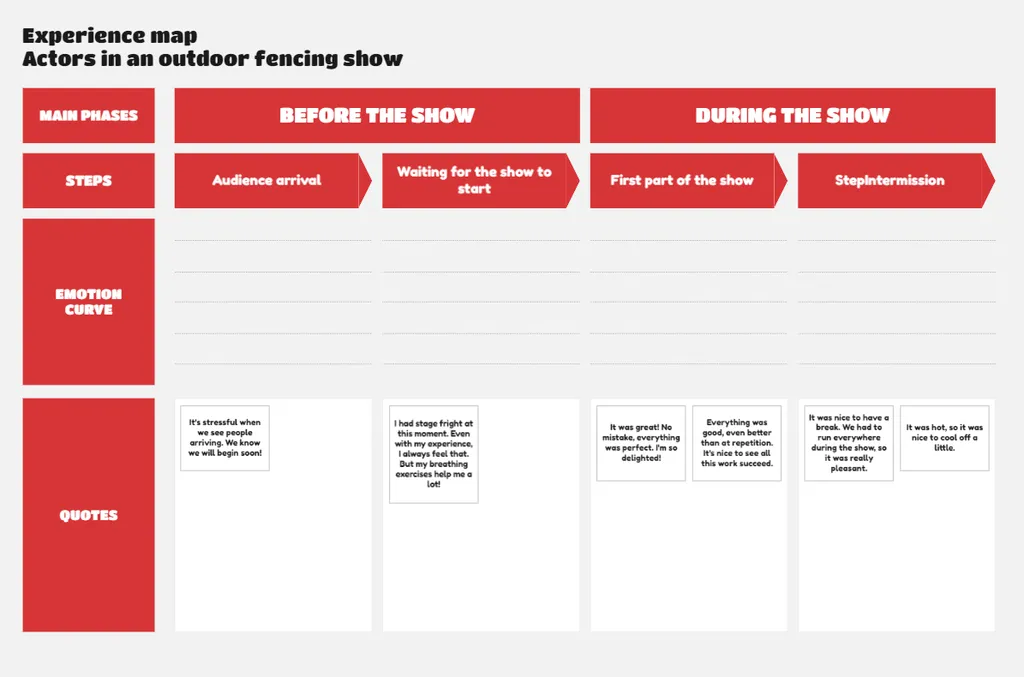
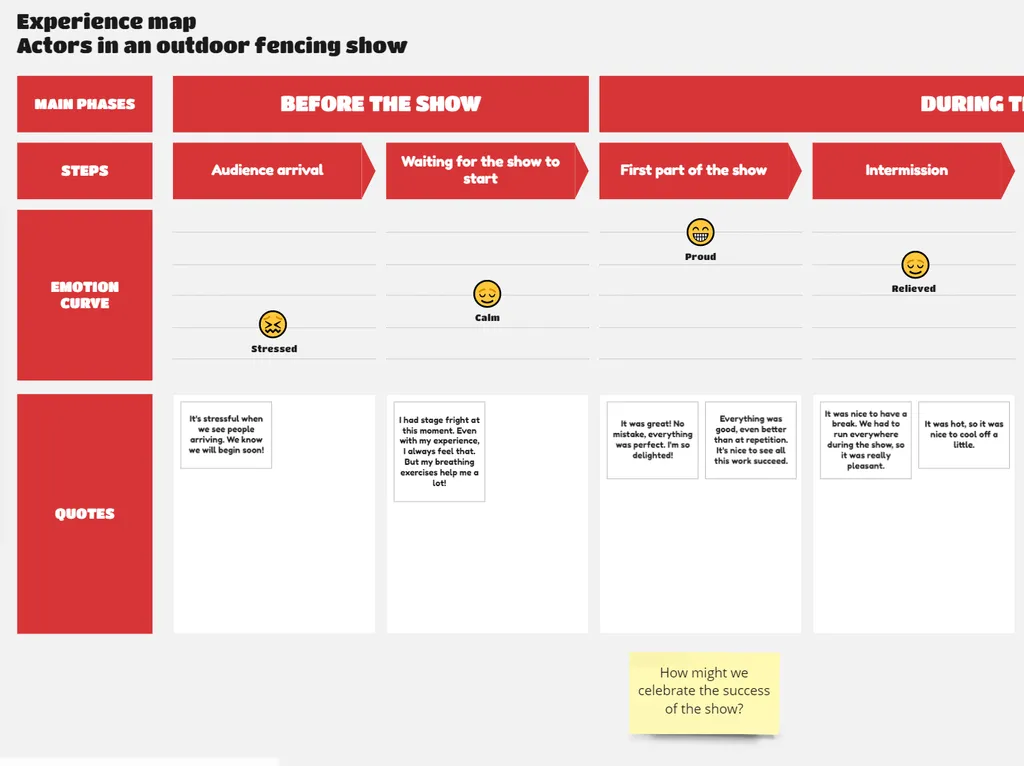
Example of an experience map for an outdoor live show experience. You can see the 5 components: phases, steps, emotional curve, verbatim quotes, and problem statements.
Anatomy of an experience map
There are many ways to represent an experience map. That said, a common foundation tends to come back, and that’s the one I work from. With experience, I’ve realized that what people care about most is the emotional curve: it really highlights the key moments of a journey. The rawest possible quotes then make it easy to understand what’s actually going on.
So here’s the experience map format I always use, and the one I find most effective. An experience map is made up of several elements:
- The phases, which let you quickly grasp the “big moments” of the journey. They’re groupings of steps.
- The steps, which describe a task carried out during the experience. Ideally, you don’t use a verb in a step name, but a noun. For example: “Creation” rather than “Create.”
- The emotional curve, which is a set of emotional levels associated with each step.
- The verbatim quotes, which are sentences spoken by the people you interviewed about this experience.
- The problem statements, framed as “How might we” questions. They reframe the need tied to a felt emotion as a problem rather than a solution. They’re necessary inputs for Design Thinking workshops.
An experience map is a snapshot of what exists right now. In my view, it’s not the right document to represent a target journey, since the content would then be interpreted and lose much of its value.
You’ll sometimes hear “journey map” used in place of “experience map.” They are indeed close deliverables with the same goal: synthesizing a user journey. However, the experience map emphasizes the emotions felt throughout an experience, while the journey map focuses more on describing all the tasks performed in a journey: it aims for completeness. That’s my interpretation, and depending on who you talk to, you may find different definitions.
Where to start?
The first step is to run interviews to understand several people’s current experience on a given topic. Ideally, you run exploratory interviews, since they let you explore the experience without preconceptions (to understand the actual steps of that experience) and, most importantly, dig into the emotions.

An interview with my colleague in the field.
First, choose your audience! I recommend building an experience map for your “primary” users, because an experience map is a lot of work! For secondary actors, a simple summary with the main ideas that emerge feels sufficient to me.
Example: in the experience “going to the dentist,” the patient and the doctor are primary actors, and the receptionist could be considered secondary. This applies differently to each experience.
Generally, 4 interviews are already enough to build an experience map that reveals some relevant early trends. But I’d suggest aiming for 8 interviews to get an even more accurate picture. Be careful, though, to interview a single group of people. When I’m trying to represent the experience of a live show, the challenge is to interview 8 performers AND 8 spectators.
Once all the interviews are done, it’s time for the synthesis. The first thing to do is to write down every quote you’ve collected! Note them somewhere in the rawest possible form: use the person’s words, in the first person.
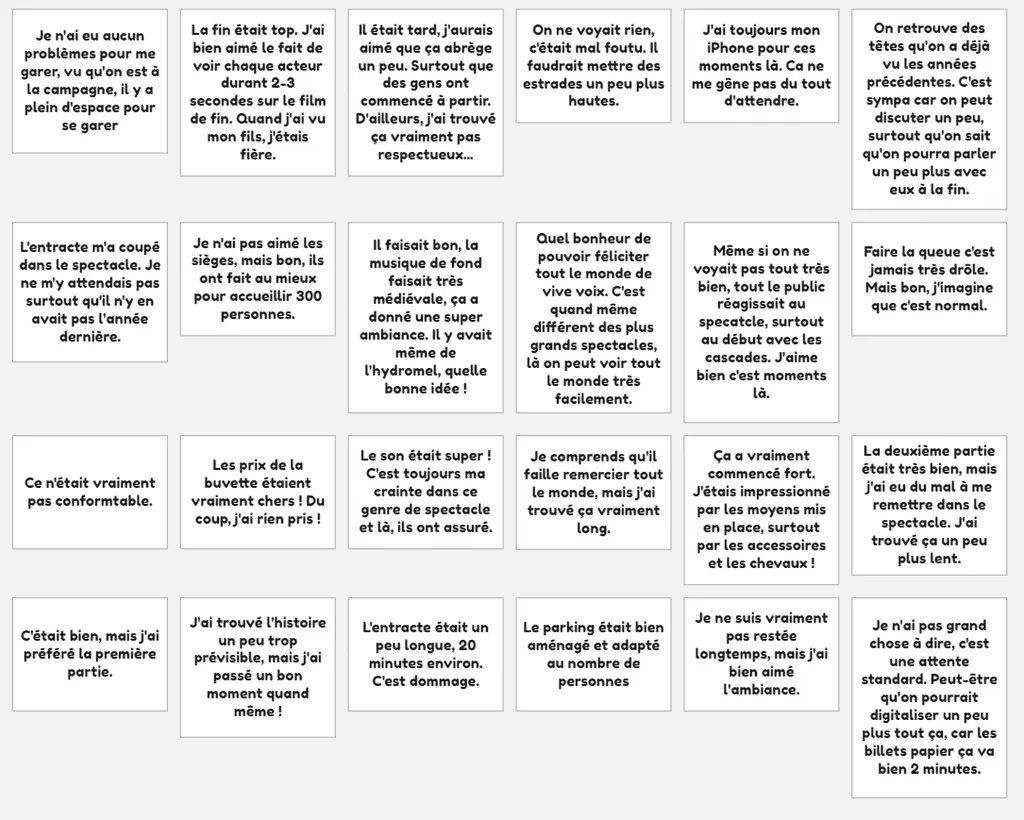
Unsorted list of quotes that fed the experience map for the spectators.
Finally, don’t forget that no matter how many people you interview, there will ALWAYS be biases. Running more interviews helps reduce those biases, but you have to accept that this will never be representative, and that’s OK. You’re taking a snapshot of what exists, surfacing trends. To “validate” a usage or a behavior, I find quantitative data is much more effective.
So remember: exploratory interviews (and therefore the experience map) are never used to validate an experience, but rather to discover it. They’re a very effective way to become aware of what happens on the ground, and then to share it with your teams.
Building your steps
My advice: don’t look at your notes. Just start writing the steps one after another, and fill in any gaps as you go.
For this, I highly recommend Miro. This tool is a giant whiteboard. It’s very handy for easily customizing an experience map. I even put together an experience map template for you, available here.
Creating and ordering the different steps for the performers’ experience map.
Some journeys aren’t linear. It’s up to you to get creative and find a way to represent them! In general, I’d encourage you to favor sequential steps because they make the map much easier to read and understand.
Once you’ve gathered your steps, group them into phases and name them. Think of the set of phases as a high-level overview of the journey, and the steps as the more detailed description. You’ll often find this kind of breakdown:
- Before the main action
- During the main action
- After the main action
Creating the phases for the performers’ experience map.
Another example: for the experience “going to the dentist,” the main phases would be “getting in touch with the practice,” “traveling to the practice,” “waiting,” “examination,” and a sample step would be “Checking in at the front desk,” “Finding the waiting room,” or “Describing the pain.”
This example also shows that you can adjust the “size” of your experience to suit your needs. You can stop at the examination phase, the payment phase, or even leaving the practice — it’s up to you. Once your journey is built, nothing stops you from adding or removing steps that feel more or less relevant. You decide the story you want to tell while staying as accurate as possible!
Building the emotional curve
Now you need to synthesize the emotional level based on your interview findings. There’s a slight bit of interpretation from the experience map’s creator at this stage. That said, it stays limited because you’ll attach the interviewees’ quotes to it: no interpretation at that level!
Unlike when building the steps, here I’d suggest doing some real grunt work first by sorting all the verbatim quotes you’ve collected during your interviews into the matching steps. Once that’s done, keep only the most explicit quotes (3 quotes max per emotion).
Sorting the quotes into the right steps for the performers’ experience map.
Then deduce the main emotion that emerges. Generally, you place an emotional level on a scale from very negative to very positive. On top of that, I’d suggest writing the actual emotion felt during the experience to be as clear as possible. Even though this definition is a bit reductive when talking about emotions (since you have to summarize them), it’s effective for showing where the irritants and the delights of a group of people sit on an experience.
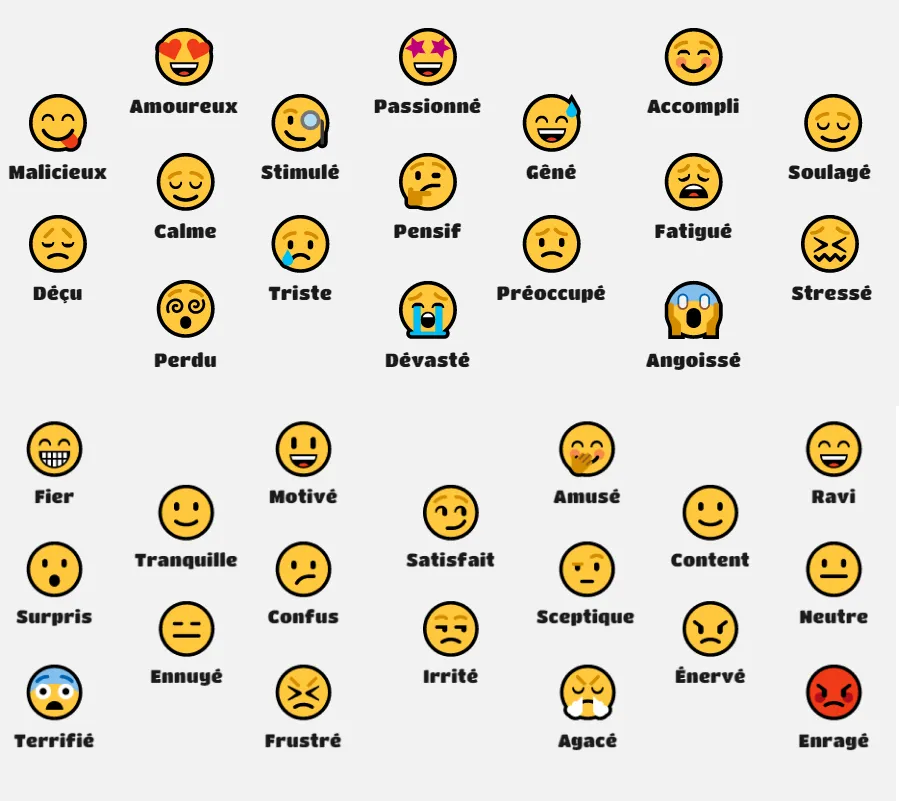
Examples of emotions and feelings to refine your experience map.
This is how you build the emotional curve for your audience. It’s a fun moment that lets you take a real step back.
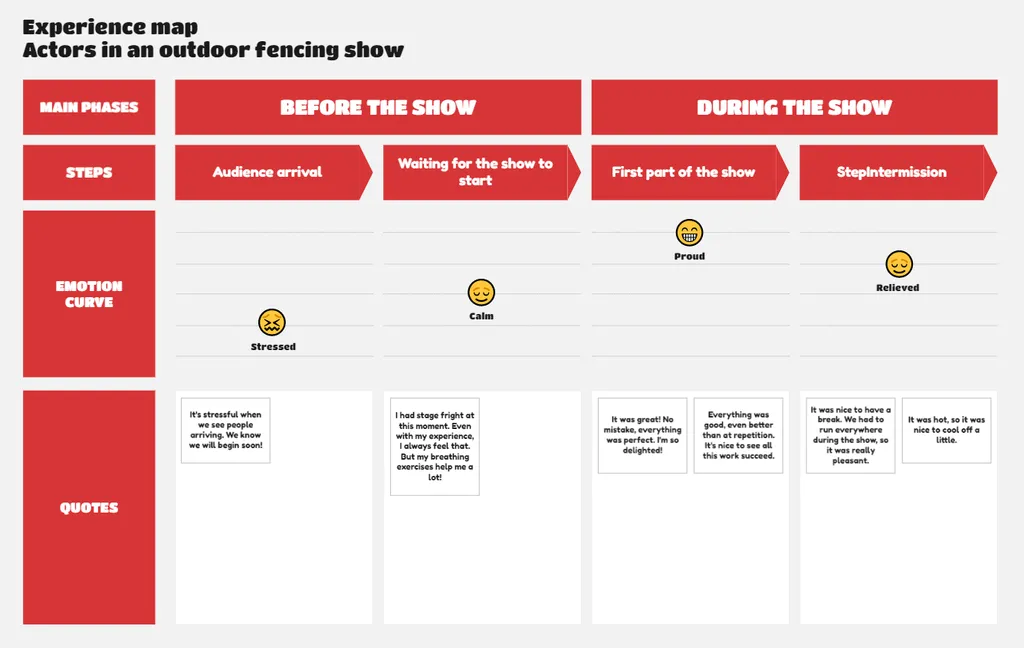
The emotions appear for the performers’ experience map.
Sometimes it takes a bit of thought: the emotion felt isn’t always obvious. A few cases come up.
I have 2 emotions felt by my group on the same step
If only one person feels differently, it’s up to you to judge whether it’s relevant or not (this is exactly why you run several interviews! So that you don’t generalize something felt by too few people).
If you see 2 groups emerge, you can put both emotions on the same step. Reading the quotes will then help you understand the different feelings.
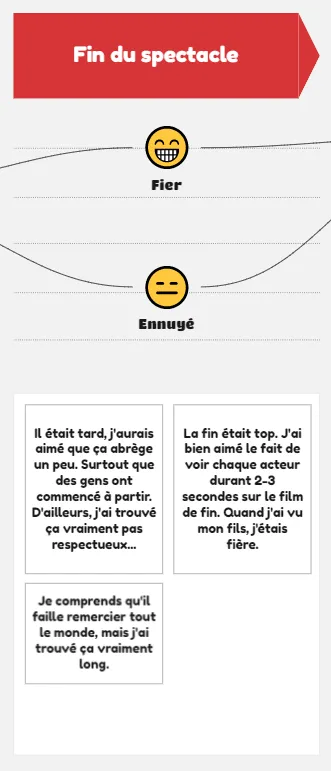
Two emotions on a single step.
I don’t know which emotion was felt after my interviews
It’s common not to have managed to fully dig into the emotions during your interviews. Either you can reach back out to the people you interviewed and ask them again (this case is fairly rare). Or you’ll have to interpret a bit.
Two things I’d like to flag here. First, empathy is a critical skill for performing well in your interviews. So you’ll have to lean on your empathy to try to understand what those people felt at the step in question and pick the right emotion. Second, the experience map is, above all, a communication tool. Be as honest as possible when you put together this kind of document, and accept that there’s a bit of interpretation — that’s OK! Nothing stops you from going back to your users afterward!
Framing problem statements
The experience map is incredibly effective for prioritizing topics. The lens is this: prioritize by extreme emotions, both negative and positive. Users are more likely to put in effort with a new interface if it addresses something genuinely painful in real life rather than a simple annoyance. In the same way, capitalizing on what works lets you celebrate the people involved by reinforcing things they already enjoy.
So look for the extreme emotions (truly negative or truly positive, the ones that stand out) and pair them with a problem statement starting with “How might we.” The goal is to address a problem tied to the emotions felt by the actors.
The problem statement appears on an “extreme” emotion.
A few typical examples:
- For an emotion of joy: “How might we celebrate…”
- For an emotion of fear: “How might we reassure…”
- For an emotion of anger: “How might we listen better about…”
- For an emotion of sadness: “How might we help bounce back…”
You should always try to answer the question “What is causing this emotion to emerge?” and then address that in the problem statement. Put differently: try not to address a solution in the problem statements.
Another example: “How might we put a patient at ease while they’re in the dentist’s chair?” rather than “How might we reduce the noise of the dentist’s drill?”
Conclusion
Your experience map is almost done. You’ve created steps and phases. You’ve attached emotions and quotes to them. Finally, you’ve added the problem statements to your experience map.
Since this document exists primarily to communicate, here are a few finishing touches so it really pops when you print it out at large format (A0 width, for example!).
- Connect the emotions to one another. This curve makes the emotional journey easier to see.
- Add colors for the extreme emotions. Again, this lets you spot the key points at a glance.
- Add photos if you have any. It will make your work feel even more authentic.
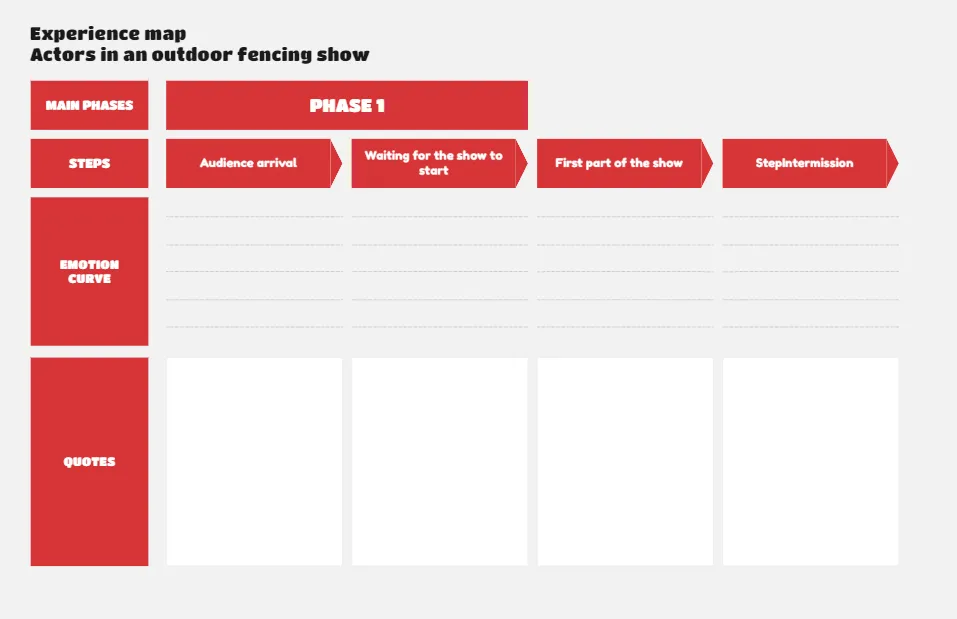
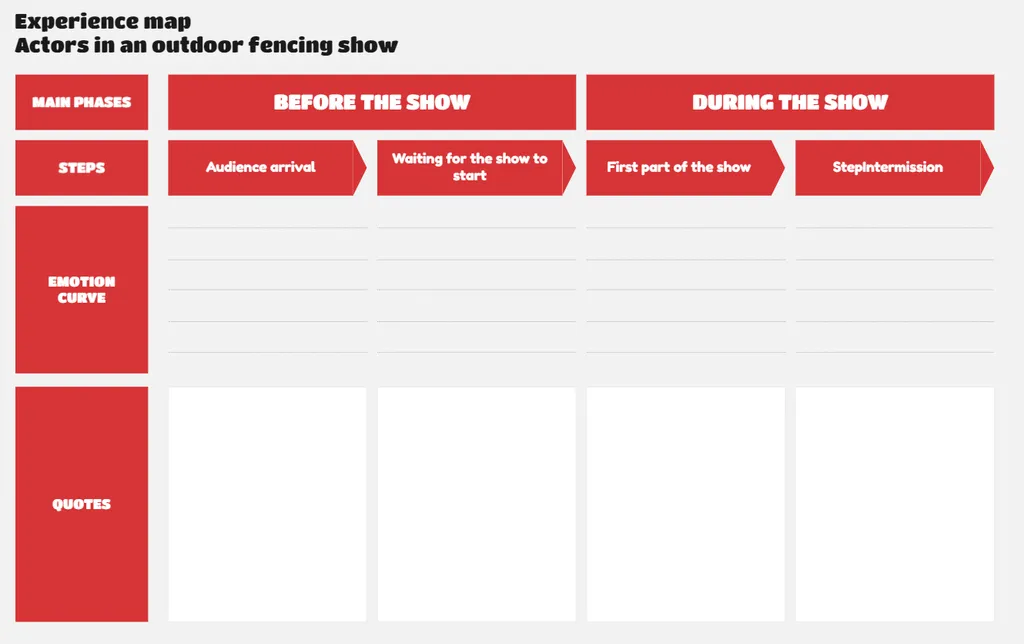
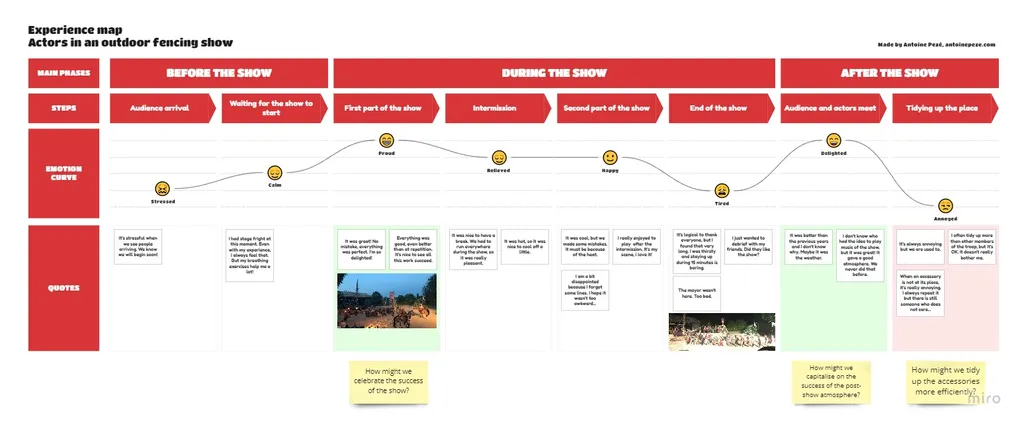
Finally, here’s an example of the performers’ experience map (in English, as you’ll have noticed) to complement the spectators’ map at the start of the article.
Have fun creating!
Going further
- Exploratory interviews: it’s essential to listen to your users. Interviews will help you know what to ask.
- Emotions: understanding emotions to better analyze your emotional curve.
- The ideation workshop: especially effective with an experience map as the starting document.
- Analyzing your interviews with AI: speed up the synthesis of your interviews.
Resources
- Official experience map template on Miro (English)
- Experience map template on Miro (French + English)
Sources
- UX Mapping Methods Compared: A Cheat Sheet (another way to approach experience maps): https://www.nngroup.com/articles/ux-mapping-cheat-sheet/
Want to go further?
I offer individual coaching to dig deeper and apply these topics to your context.
Book a session