How to build a Service Blueprint
TL;DR
Summary
A Service Blueprint is a mapping tool that visualizes an entire service, from the customer’s experience all the way to the internal processes that make it possible. It makes the usually invisible visible.
Goals
Understand how a service works as a whole, identify friction points between internal teams and the customer, and spot improvement opportunities by combining the user perspective with the operational perspective.
What is a Service Blueprint?
A Service Blueprint is a visual map that represents a service by stacking customer actions, visible interactions, invisible processes, and support systems on a single document.
The concept was introduced by G. Lynn Shostack in 1984 in a Harvard Business Review article titled “Designing Services That Deliver.” Shostack started from a simple observation: services are intangible, which makes them hard to design and improve. So she proposed a visual tool, inspired by engineering blueprints, to make the invisible visible.
The model was later enriched by Mary Jo Bitner, Amy Ostrom, and Felicia Morgan in 2008, who formalized the 5 layers and 3 separation lines we use today. Their main contribution was clearly separating what the customer sees (frontstage) from what they don’t (backstage), and adding support processes and physical evidence.
The core idea is that a service is never just what the customer perceives. Behind every interaction sits an internal mechanism. The Service Blueprint connects these two worlds to identify gaps, redundancies, and opportunities.
How is it different from an experience map?
If you’ve already built an experience map, you’ve mapped the user’s emotional journey. The Service Blueprint goes further: it keeps the customer perspective but adds the entire internal machinery of the service. The experience map answers “What does the customer go through?” The Service Blueprint answers “What does the customer go through AND what happens behind the scenes to make that experience possible?”
The two tools are complementary. I’d suggest starting with an experience map to understand the emotional journey, then building a Service Blueprint to understand the mechanisms that produce those emotions.
The 5 layers of a Service Blueprint
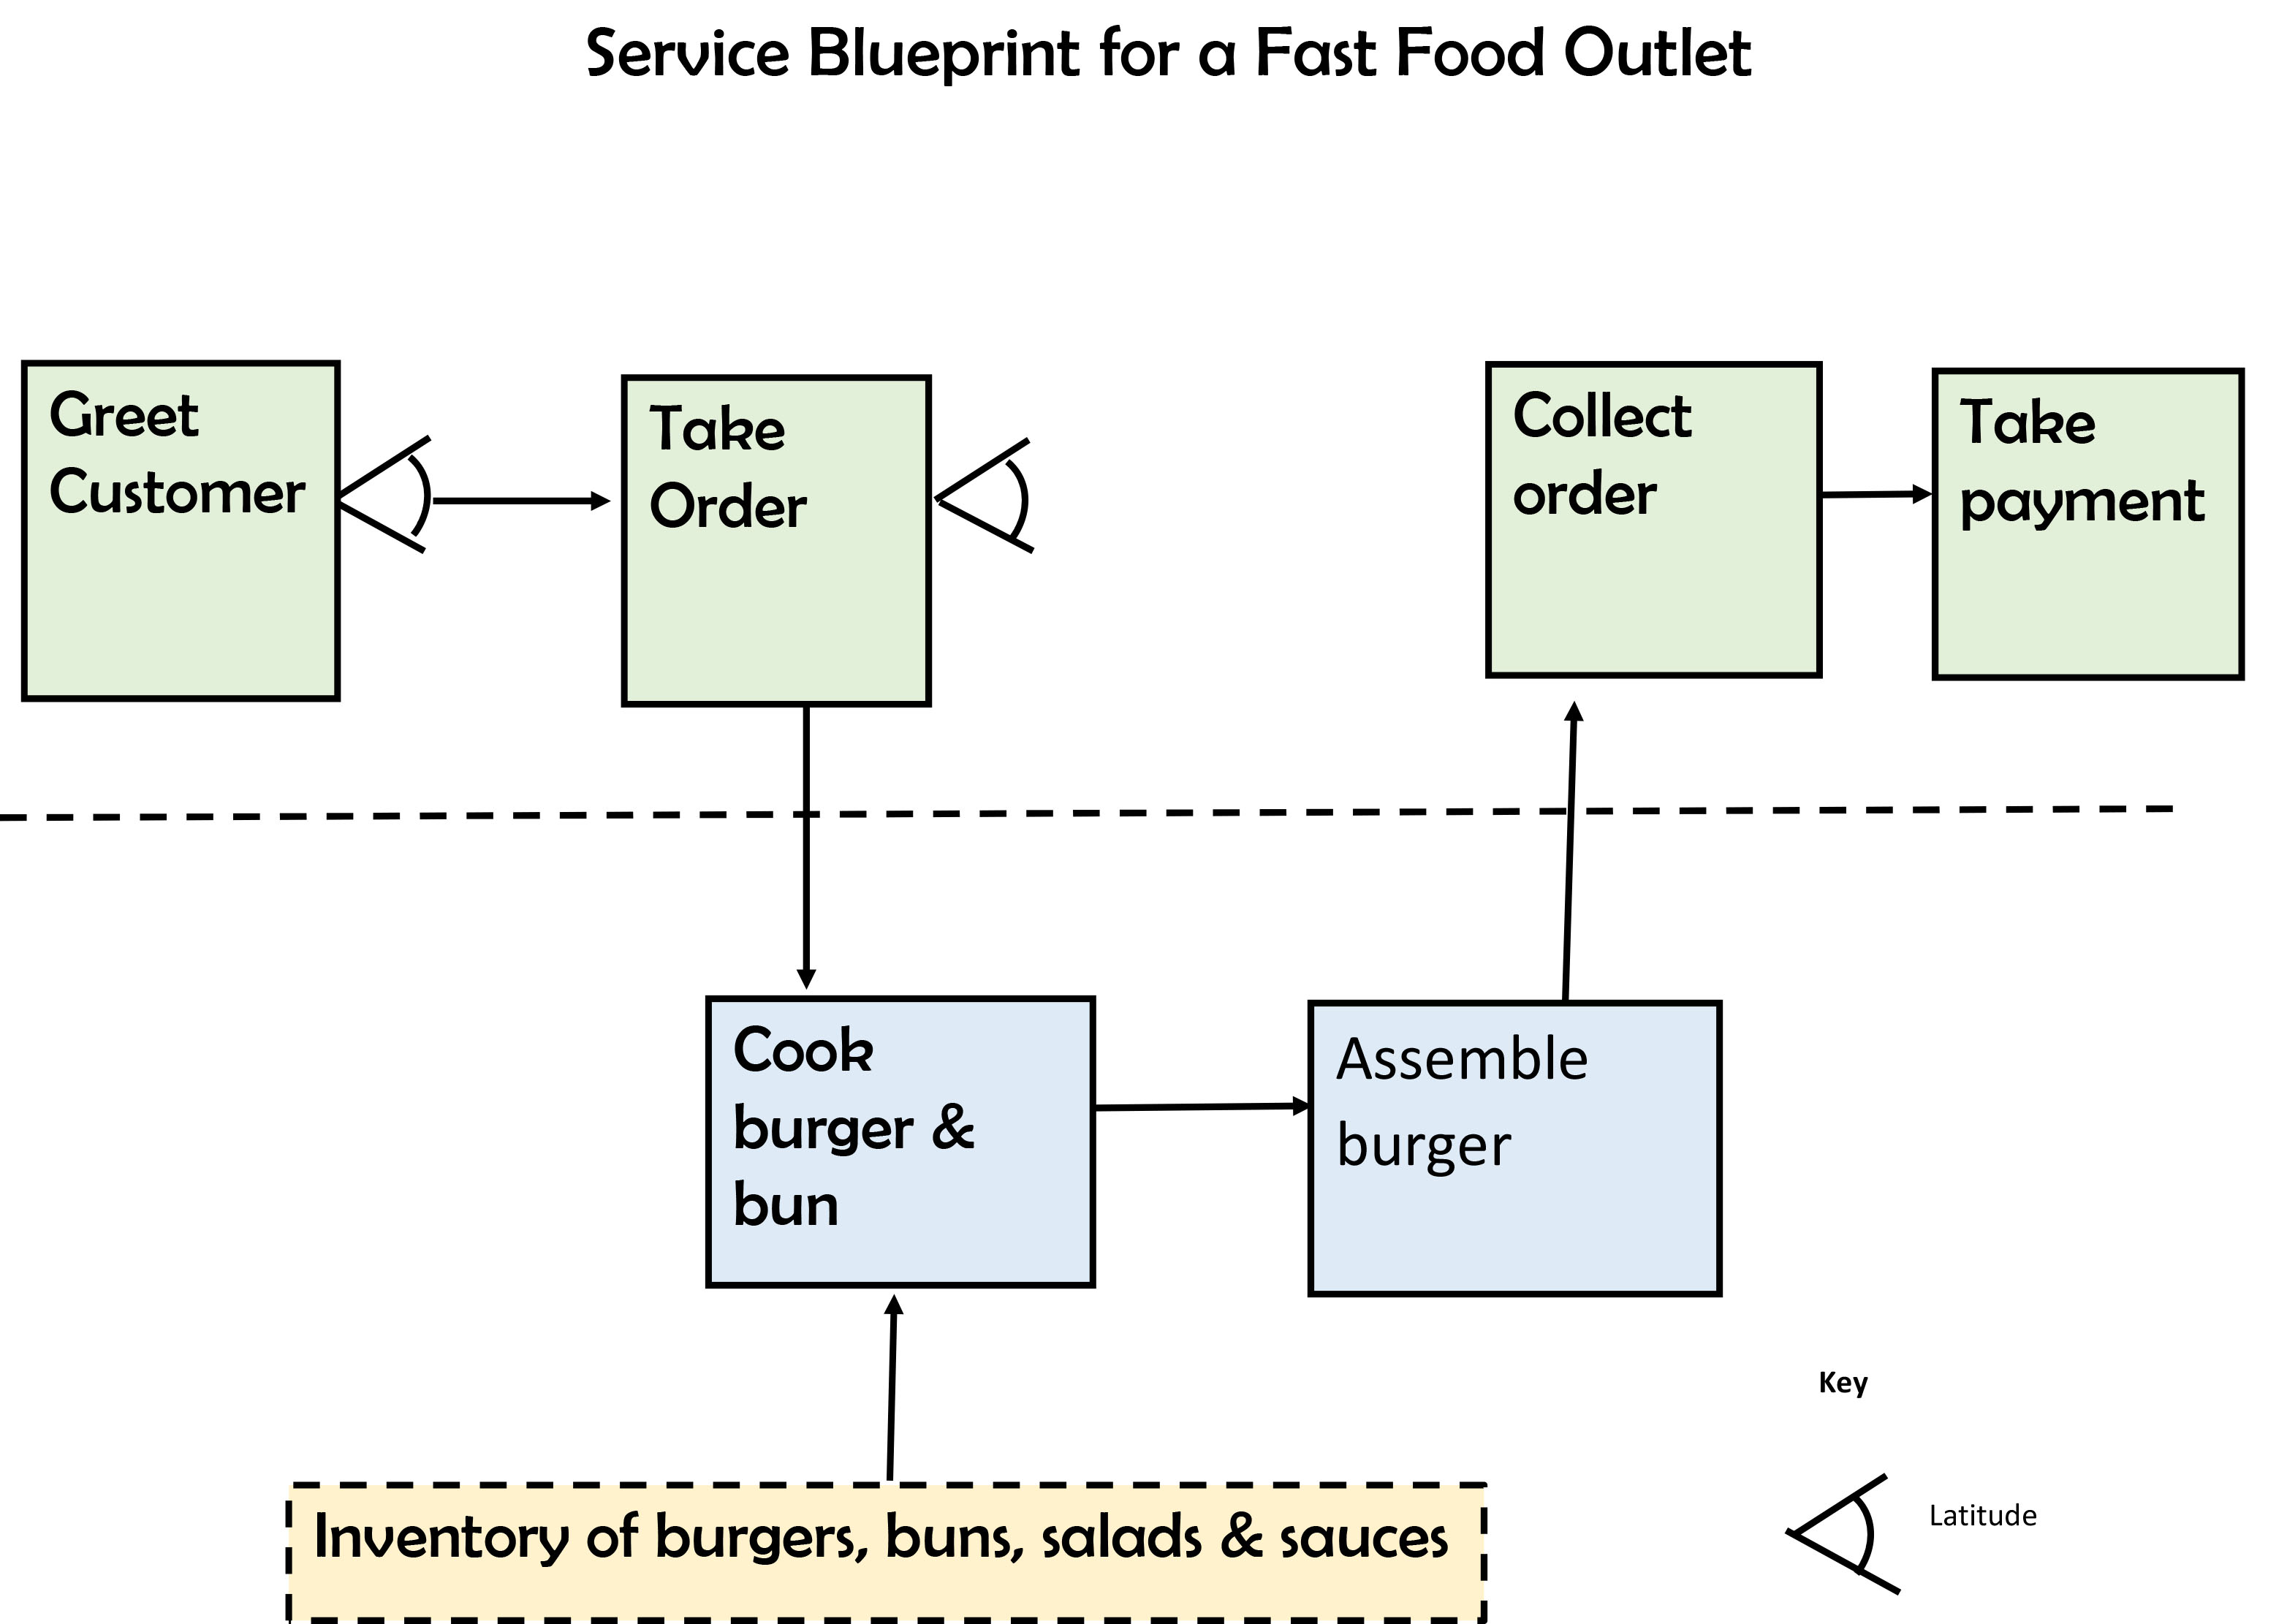
Example Service Blueprint applied to a fast-food service. Credit: BronHiggs, CC BY-SA 4.0, via Wikimedia Commons
A Service Blueprint is read top to bottom. Each layer represents a deeper level inside the service.
1. Physical Evidence
At the very top of the blueprint, you place the physical evidence: the tangible elements the customer sees, touches, or uses at each step. It can be a website, a confirmation email, a sign, a receipt, a uniform, a mobile app, a parcel, or an invoice.
Physical evidence matters because it shapes how the service is perceived. A well-written confirmation email reassures. A damaged parcel worries. These are the tangible cues the customer relies on to judge service quality.
2. Customer Actions
The second layer describes everything the customer does throughout their journey. These are the concrete actions: searching for a product on the site, filling out a form, calling support, walking into a store, opening a parcel, leaving a review. This layer is often the easiest to fill out because it matches the classic user journey.
3. Frontstage interactions (Onstage / Visible Contact Employee Actions)
The third layer represents the actions of employees that are visible to the customer. This is the in-store advisor greeting them, the chatbot replying, the automated email being sent, the delivery person ringing the doorbell. Anything that happens “on stage,” in front of the customer.
4. Backstage actions (Backstage / Invisible Contact Employee Actions)
The fourth layer covers employee actions that are invisible to the customer but directly tied to the service. This is the order picker packing the parcel, the developer maintaining the site, the manager scheduling teams, the accountant processing the invoice. The customer never sees these actions, but they’re essential.
5. Support Processes
The fifth layer, at the bottom, gathers the internal systems, tools, and processes that make the service work. The CRM, the inventory management system, the scheduling software, the database, the payment API, the logistics provider. These are the technical and organizational foundations of the service.
The 3 separation lines
The 5 layers are separated by 3 horizontal lines. These lines matter because they represent organizational boundaries.
The Line of Interaction
Placed between customer actions and frontstage interactions, it represents the direct point of contact between the customer and the service. Each time this line is crossed, there’s an interaction. It’s a moment of truth: the service is judged by the customer at that exact instant.
The Line of Visibility
Placed between frontstage and backstage, this is the most important line on the blueprint. It separates what the customer sees from what they don’t. Anything above is visible, anything below is invisible to the customer. This line helps identify moments when the customer is waiting without knowing what’s happening, which often creates frustration.
The Line of Internal Interaction
Placed between backstage and support processes, it marks the boundary between employees in contact with the service and the support systems. Bottlenecks often live here: a slow system, a poorly integrated tool, a manual process that could be automated.
Building a Service Blueprint: a 3-hour workshop
Here’s a 3-hour workshop format that has proven itself. It can be adapted depending on the service’s complexity, but it’s a solid baseline.
Prerequisites
Before the workshop, make sure you have:
- The results of a user research effort (ideally exploratory interviews or an experience map)
- Enough knowledge of internal processes (interview the operational teams if needed)
- A defined scope: which journey are you going to map? From first contact to delivery? From sign-up to first use?
Materials
- A free wall at least 3 meters wide (or a whiteboard)
- Sticky notes in 5 different colors (one per layer)
- Black markers (one per participant)
- Colored tape to draw the lines
- A roll of kraft paper if you don’t have a white wall
- A timer
- A camera to document the result
If you’d rather go digital, Miro or FigJam work great. Prepare a template with the 5 horizontal bands and the 3 lines drawn ahead of time.
Group composition
- 1 facilitator (you), who doesn’t participate but facilitates
- 2 to 3 people on the “customer” side (designers, product managers, customer success)
- 2 to 3 people on the “operations” side (developers, ops, support, logistics)
- Ideally 6 to 8 people in total
The richness of a Service Blueprint comes from crossing perspectives. So it’s essential to have people who know the customer AND people who know what happens behind the scenes.
Step 1: Framing and prepping the wall (20 minutes)
- Present the workshop goal: “By the end of these 3 hours, we’ll have a complete map of the service for journey X, helping us identify internal and external friction points.”
- Briefly explain the 5 layers and 3 lines. A simple diagram on the board is enough.
- Use the colored tape to draw the 3 horizontal lines on the wall. You’ll get 5 horizontal bands.
- Label each band with a sticky note: Physical Evidence, Customer Actions, Frontstage, Backstage, Support Processes.
- Define the journey scope with the group. Write the starting point on the left and the end point on the right.
Step 2: Map customer actions (30 minutes)
This is the starting point. Always start with the customer.
- Ask participants: “You have 5 minutes to write on sticky notes every action the customer takes during this journey. One action per sticky, write in capital letters.”
- Collect the stickies and place them chronologically in the “Customer Actions” band, left to right.
- Discuss as a group to fill gaps, merge duplicates, and order actions. Aim for 10 to 20 steps.
- Verify the journey is coherent by reading it aloud: “The customer does X, then Y, then Z…”
If you already have an experience map, use it as a base. The steps in the experience map directly map to the customer actions.
Step 3: Add physical evidence (15 minutes)
- For each customer action, ask the group: “What does the customer see, touch, or use at this step?”
- Write each piece of physical evidence on a dedicated color sticky and place it in the top band, vertically aligned with the matching action.
- Some steps won’t have physical evidence. That’s fine.
Step 4: Map the frontstage (20 minutes)
- For each customer action, ask: “Who or what does the customer interact with directly?”
- Write down the frontstage interactions and place them in the matching band.
- Draw vertical arrows between customer actions and frontstage interactions to materialize touchpoints.
Step 5: Map the backstage (30 minutes)
This is often the richest step in terms of discussion. Operational teams will get to explain what really happens behind the scenes.
- For each frontstage interaction, ask: “What needs to happen behind the scenes to make this interaction possible?”
- Write the backstage actions and place them in the matching band.
- Don’t hesitate to add backstage actions that aren’t directly tied to a frontstage action but are needed to keep the service running (e.g., maintenance, stock updates).
You have 30 minutes for this step. It’s tight, but time-boxing matters to avoid getting lost in details.
Step 6: Identify support processes (20 minutes)
- For each backstage action, ask: “Which tool, which system, which provider is used to perform this action?”
- Write the support processes in the bottom band.
- Connect them to the backstage actions with arrows.
Step 7: Identify friction points (30 minutes)
This is the most strategic step. The blueprint is now complete. Time to put it to work.
- Hand out red dot stickers (or red marker dots) to each participant.
- Ask them to place a red dot on every blueprint element that seems problematic. Brief: “You have 5 minutes to spot points where things stall, where it’s slow, where it’s fragile, where the customer waits without knowing what’s happening.”
- Discuss the most frequent red dots together. Those are your priorities.
- For each major friction point, write a “How might we…” problem statement on a yellow sticky and place it under the matching point.
Step 8: Documentation and next steps (15 minutes)
- Photograph the blueprint from every angle.
- Digitize it cleanly in Miro or FigJam within 48 hours of the workshop. The longer you wait, the more context you lose.
- Share the result with all participants and absent stakeholders.
By the end of this workshop, you should have:
- A complete blueprint of the targeted journey with all 5 layers filled in
- A list of 3 to 5 priority friction points framed as “How might we”
- Photo documentation of the wall
Tips and best practices
Always start with the customer
It’s tempting to start with what you know best (the internal processes). Resist. The Service Blueprint must be anchored in the customer’s reality. Start with their actions, then go down layer by layer.
Stay at the right level of detail
A common trap is wanting to map everything. An overly detailed Service Blueprint becomes unreadable. Aim for a consistent level of granularity: if a customer action is “Order online,” the matching backstage action can be “Process the order” without detailing every click in the back-office.
Conversely, a blueprint that’s too vague is useless. If all your backstage actions read “The team handles it,” you need to dig deeper.
Spot the “waiting moments”
The most critical moments in a service are often when the customer is waiting without knowing what’s happening. For example: they sent in a form and are waiting for a response. What’s happening during that time? The blueprint helps you visualize these moments and ask: “Could we make this wait visible? Could we shorten it?”
Don’t confuse frontstage and backstage
The boundary is sometimes fuzzy. The rule is simple: if the customer can see, hear, or perceive the action, it’s frontstage. If the customer doesn’t know the action exists, it’s backstage. An automated email sent to the customer is frontstage. The business rule that triggers that email is backstage.
Keep your blueprint up to date
A Service Blueprint is a snapshot at a given time. Services evolve. I’d recommend updating it at least once a quarter, or every time there’s a major change in the journey. Keep it in a collaborative tool the whole team can access.
Common mistakes
-
Building the blueprint alone in your corner. The Service Blueprint is an alignment tool. It loses all its value if it’s built by a single person. Involve business, technical, and design teams.
-
Forgetting physical evidence. It’s the most often neglected layer. Yet it’s physical evidence that gives the service its tangible quality.
-
Mapping the ideal journey instead of the real one. The blueprint must show what actually happens, not what should happen. Bugs, workarounds, and manual processes need to be in there.
-
Doing nothing with it. The blueprint is an analysis tool, not an end in itself. The friction points identified must become concrete actions.
-
Trying to fit everything onto a single blueprint. If your service has very different journeys (new customer vs. existing customer, for instance), build one blueprint per journey.
Going further
- The experience map: the emotional mapping of the customer journey, complementary to the blueprint
- Exploratory interviews: to feed the blueprint with field data
- The ideation workshop: to work on the problem statements identified in the blueprint
- Design Thinking: the broader approach the blueprint fits into
Sources
- Shostack, G. Lynn. “Designing Services That Deliver.” Harvard Business Review, January 1984.
- Bitner, M.J., Ostrom, A.L. & Morgan, F.N. “Service Blueprinting: A Practical Technique for Service Innovation.” California Management Review, 2008.
- Service Blueprints: Definition (Nielsen Norman Group): https://www.nngroup.com/articles/service-blueprints-definition/
Want to go further?
I offer individual coaching to dig deeper and apply these topics to your context.
Book a session